Calibration and Efficiency
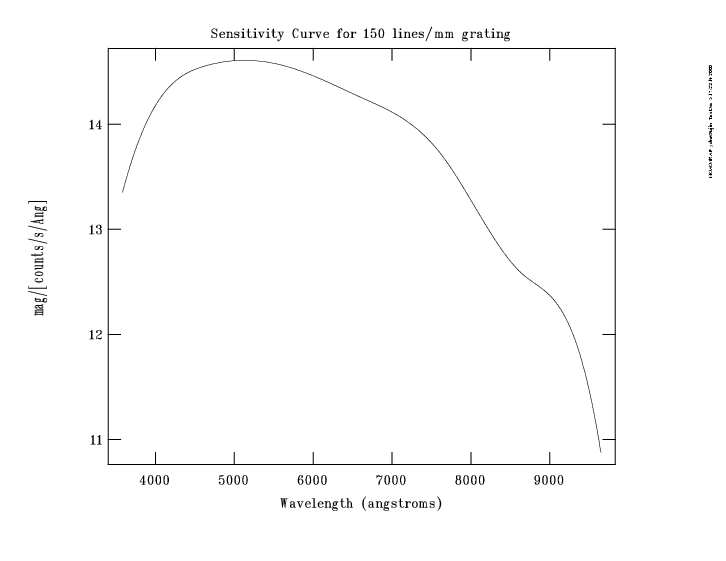
The sensitivity curve for the 150 lines/mm grating is calculated based on the observations of standard stars Feige 15 and Feige 34 during December 1999. A slit width of 600 microns (5 arcsec) was used. Blue ([OII] to [SII]) and red ([OI] to [SIII]) spectra were obtained separately at grating angle 2o40' and 4o00' respectively. The combined curve is given below in units of AB magnitude that gives 1 count/s/Å at standard gain (1.85 e-/ADU). The spectra had been corrected for atmospheric extinction using the curve for Kitt Peak and hence the following curve represents sensitivity of the telescope+spectrograph+CCD combination.

Based on the above curve, sensitivities at selected wavelengths are given in the following table. This table also includes the sensitivities obtained by RJT using a 1999 observation of the standard star BD2546. The latter values were not corrected for the atmspheric extinction and hence represent the sensitivities of the telescope+atmosphere+spectrograph+CCD combination. The last column in the table is the typical sky brightness at OAGH in units of AB mag/arcsec2.
| AB magnitude that gives 1 count/s/Å at standard gain (1.85 e-/ADU) | Sky brightness | ||
|---|---|---|---|
| Wavelength (Å) | AB mag | AB mag (RJT) |
AB Mag/arcseg2 |
| 4000 | 14.20 | 14.00 | |
| 5000 | 14.60 | 14.50 | 21.2 |
| 6000 | 14.45 | 14.40 | 20.7 |
| 7000 | 14.10 | 13.90 | 21.1 |
| 8000 | 13.30 | 19.8 | |
| 9000 | 12.40 |
18.3 |
A complete sensitivity curve for all the gratings available at the telescope will be posted in this page shortly.
Sky Spectrum at OAGH
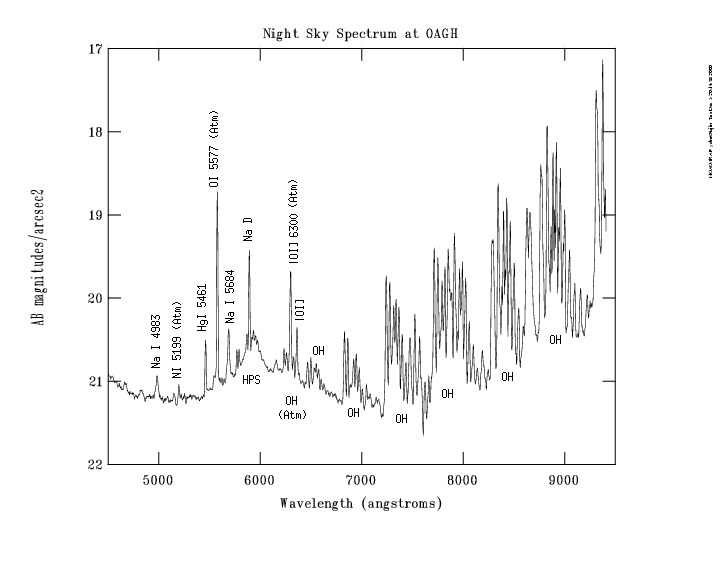
A typical sky spectrum at OAGH is shown below. This spectrum corresponds to December 1999 observations. Important atmosperic and city lines have been identified.

Address: Luis Enrique Erro # 1, Tonantzintla, Puebla, Mexico ZIP Code. 72840 Tel: (222) 266.31.00 Contact: difusion@inaoep.mx
This work is licensed under a Creative Commons License Attribution-Noncommercial-No Derivative Works 2.5 Mexico.


